It’s been almost a year since we have touched on this mythical market indicator at Investing and Money, and wanted to revisit it to see if its perfection is still intact. When you think about it, can one macroeconomic indicator of any kind actually predict a recession and the market moves that follow? It seems highly unlikely, otherwise every economist would tout it and every market participant would invest upon it. Even the indicators creator, Campbell Harvey, now a finance professor at Duke University, states, “It is naive to think that you can just forecast the complex U.S. economy with a single measure from the bond market.” Well, it is almost perfect.
If you haven’t guessed we’re referring to the inverted yield curve and its predictable nature in forecasting recessions. An inverted yield curve occurs when short term interest rates exceed long term rates. In other words, the yield on longer term bonds (such as 10-year Treasury bonds) becomes lower than the yield on shorter term bonds (such as 2-year Treasury notes). This inversion is often viewed as a reliable recession indicator because it has historically preceded economic downturns.

When the yield curve inverts, it reflects market pessimism about future economic prospects. Investors are essentially saying that they expect economic conditions to deteriorate. The yield curve reflects expectations about future interest rates and inflation. An inversion suggests that investors anticipate lower inflation and slower economic growth ahead. So how is the inversion working this time around? According to Ed Hyman, chairman of Evercore ISI, “It’s not working. So far, the economy is doing fine,” though he added the caveat that a recession could be just a little late in arriving this time.
As you may have guessed, the Federal Reserve is a key player in this whole puzzle. Like they said in the old Wall Street commercial, “When E.F. Hutton talks, people listen.” The same is obviously true today with the Fed and when Chairman Jerome Powell speaks. As such, central banks play a crucial role in shaping the yield curve. When the central bank raises short term interest rates, usually in response to inflation, it can lead to an inversion. However, not all yield curve inversions are the same. Some occur because the central bank tightens monetary policy (raising short term rates), while others result from falling long term yields, due to market expectations.
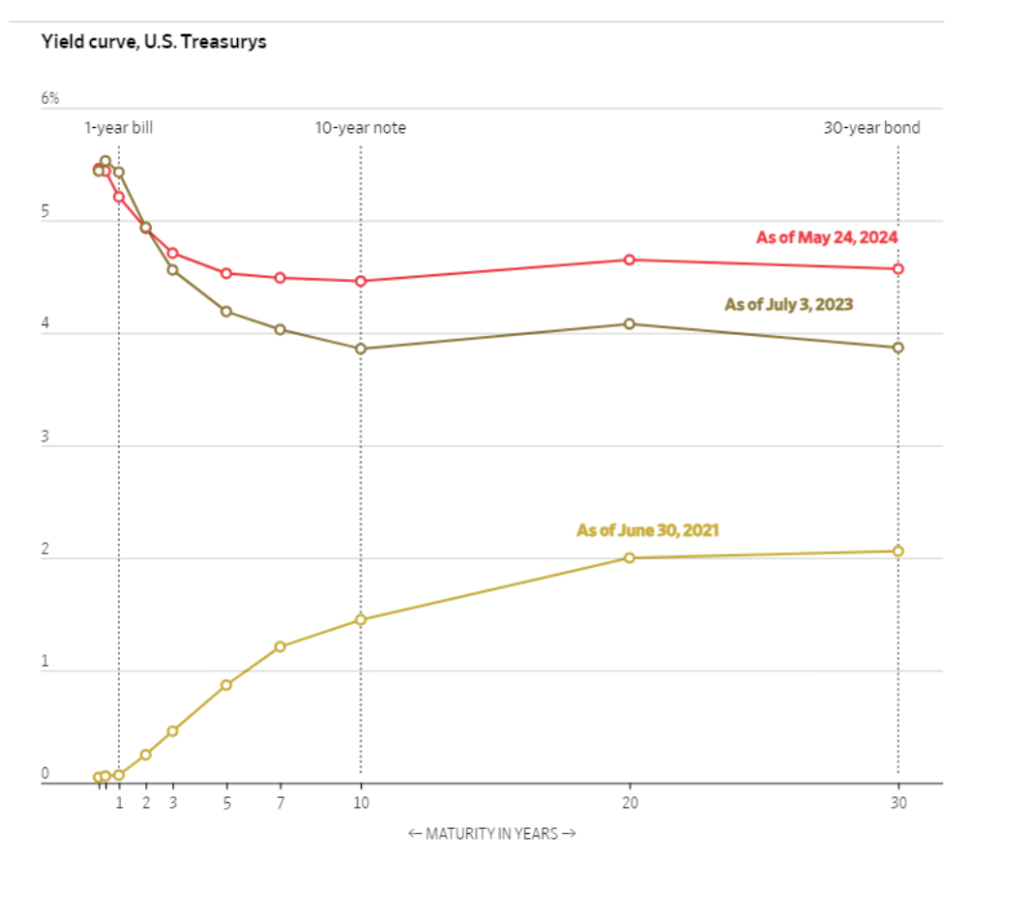
One can see the progression of the inversion in the following chart. What you have in 2021 is essentially a normal yield curve, meaning that investors demand higher yields for holding debt for a longer time, bringing uncertainty into the picture. In 2023 the yield curve is in fact inverted, with the shorter term treasury bills yielding higher returns than the longer maturing notes and bonds. Currently, we find the inversion flattening in comparison, perhaps due to the unknown nature of the next several moves by the Federal Reserve.

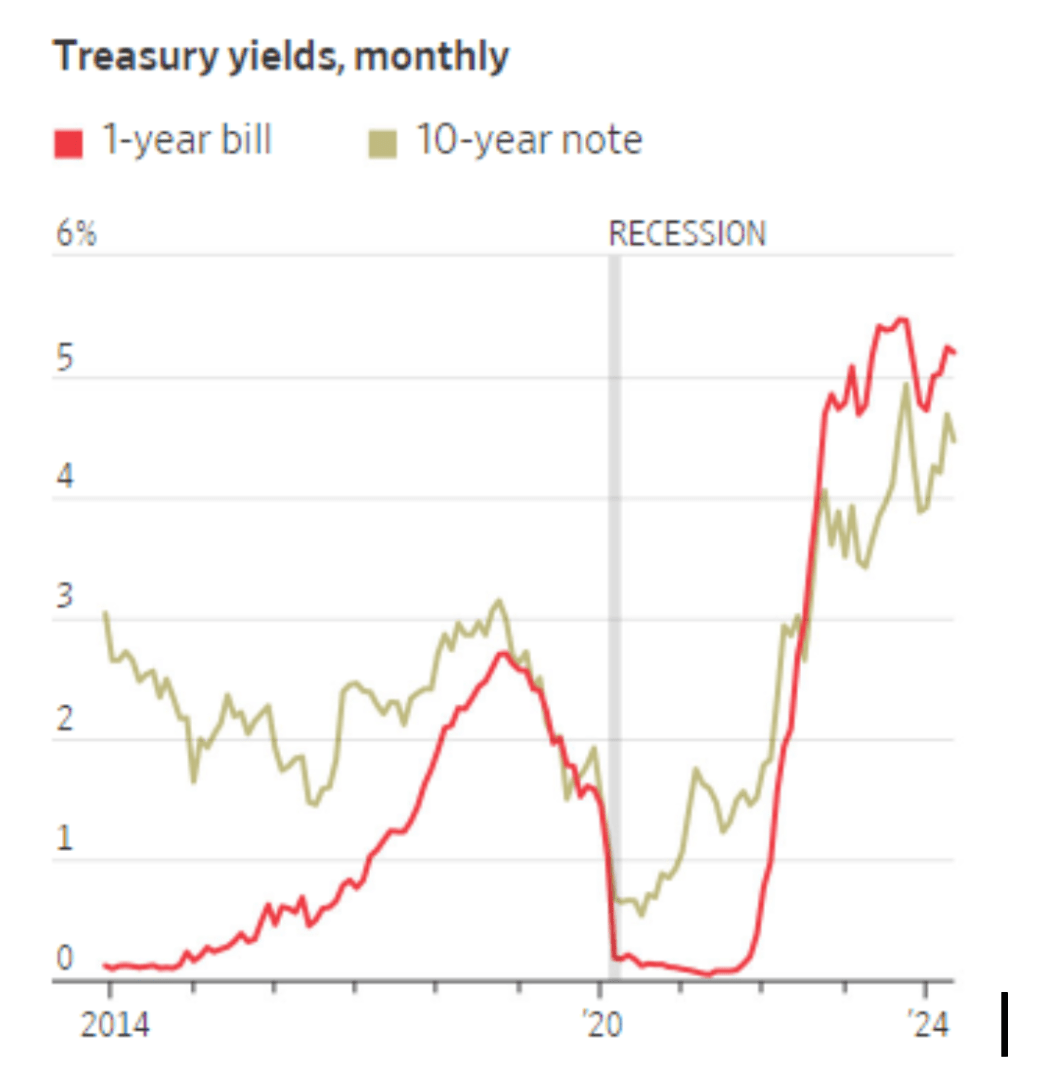
We’ve mentioned it before but it bears repeating because of its historic success as a predictive indicator. Numerous studies have documented the ability of the yield curve slope, measured as the difference between long term and short term yields, to predict future recessions. Despite variations in measurement and conditioning variables, the yield curve’s predictive power persists across different studies and time periods. The yield curve inversion in 2019 raised concerns about an impending recession. Unlike previous inversions, this one was primarily driven by falling long term yields rather than central bank rate hikes.
So now you’re asking, okay, the yield curve is currently inverted, but no recession. What gives? Given the somewhat unpredictable time lag between when an inverted yield curve emerges and when a recession begins, the phrase “near future” may not mean much too some investors. Remember, it’s true, the yield curve has accurately signaled almost every recession since 1955. Astute observers, however, will point to the lone exception, 1966, when the yield curve got it wrong. On the surface, there’s little evidence the U.S. economy will soon waddle or wane. Note that technically a recession is two consecutive quarters of negative GDP. We have not had that. According to Jared Franz, economist for the Capital Group, “There’s more demand than supply, whether you’re looking at the labor market or housing or retail spending, and this looks likely to persist for the next couple of years, which is why I wouldn’t anticipate a recession in 2024 or even 2025.”
What about the near future? Are we out of the woods yet? A couple of points worth mentioning. Consumers and corporations are feeling the squeeze from the Federal Reserve’s 11 rate hikes since March 2022. The Fed has pushed the benchmark overnight borrowing rate to a range between 5.25% and 5.5%, which is its highest level in 22 years. In addition, according to the Congressional Budget Office, the deficit is expected to grow from 5.3% of GDP in 2023 to 6.1% of GDP in 2024 and 2025. Government spending may avert a recession or at least push it out significantly relative to a ‘classic’ cycle more driven from monetary policy. As more macroeconomic data comes forward, we are likely to get a clearer picture as to which way the Fed will go, so don’t hold your breath that the inverted yield curve indicator will miss the mark this time.


